
- Home
- Omeka & Neatline: Tutorial Two
The Oxford Outremer Map
The Possibilities of Digital Restoration
Omeka Mapping Tutorials
Tobias Hrynick, Ph. D. Student, Fordham University
Contents
- About the Tutorials
- Tutorial One: Getting Familiar with Omeka
- Tutorial Two: Creating an Annotated Historical Map Using Omeka Neatline
- Conclusion
III. Tutorial Two: Creating an Annotated Historical Map Using Omeka Neatline
What follows is a walk-through, which should guide you in making an interactive map like the one visible at http://frenchofoutremer.com/omeka/exhibits/show/oxford-outremer-map/interactive-map.
The walk-through does not exactly follow our own process, since we frequently made bad decisions, and had to extricate ourselves from dead-ends; instead, it gives the process in somewhat idealized form. The walk-through is also necessarily incomplete: you will have to make choices about which platforms and options suit your project best, and the range of possibilities is too wide to be described in any single guide. Instead, we hope to provide you the tools you will need to seek out outside information, make informed decisions, and to extricate yourself when you come into difficulties.
System Requirements
To create an annotated historical map using Neatline, you will at first need to have Geoserver and Omeka installed on a server. Exactly how to install these two pieces of software will vary according to your choice of server (see: Software and Servers), so it is not possible to provide precise directions. Note, however, that many servers are designed to facilitate easy installation of both platforms, and though the exact method of installation, and its degree of difficulty, will vary depending on the type of hosting you choose, it need not be daunting. See also https://omeka.org/codex/Installation for general information on the installation process, and see the discussion of servers in the introduction for some possible options.
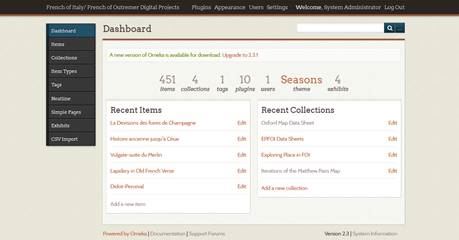
Understanding the Omeka Dashboard
Once Omeka is installed on a server, you will be able to begin creating and editing web-pages. Logging onto your Omeka account will bring you to Omeka’s “Dashboard,” from which pages can be created, deleted, and edited, and from which more general adjustments can be made to your site’s settings. Along the top of the dashboard, you will see the options, “Plugins,” “Apearence,” “Users,” and “Settings.”
- Plugins gives you access to set fragments of code which can be implemented on your site to do certain things, ranging from the very simple (create a page of text) to the quite complex (like the Neatline tool).
- Appearance allows you to adjust the overall visual design of your site through the implementation of pre-established themes.
- Users allows you to set up access for multiple people, with varying levels of power to make changes.
- Settings is a more miscellaneous category, containing a wide variety of basic choices – in the course of our Omeka projects, we have very rarely had to adjust underlying settings.
Installing Plugins
The plugins which we used to make the Oxford Outremer Map website are the following:
- Neatline
- Neatline Widget – Neatline Simile Timeline
- Exhibit Builder
- SimplePages
- CSV Import
- Social Bookmarking
- Simple Contact Form.
Many of these plugins we used are designed to manage peripheral parts of our project; the “CSV Import” plugin, for example, allowed us to upload files as spreadsheets for others to download.
In the interest of space, I will only discuss the Neatline plugin, which is required for the annotated map itself – you should install this now; it will be possible to extrapolate from these instructions to add other plugins later.
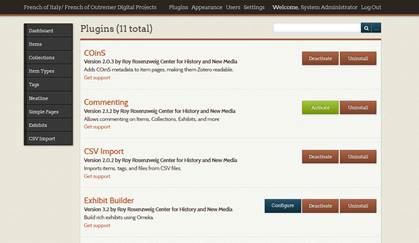
Plugins are installed in a two-step process:
First: the files for the plugins (which can be downloaded from http://omeka.org/add-ons/plugins/ ) must be positioned on the server in the place where Omeka can access it. The exact directory structure of your server will vary, but within the folder labeled “omeka,” will be another labeled “plugins.” Upload the unzipped folder containing the plugin files to the “plugins,” folder.
Second: once the software is uploaded, go to the Omeka dashboard, click “plugins,” on the top navigation bar, scroll down until you find the name of the plugin whose files you uploaded, and click on the button labeled “install.” New options will appear on the left-hand navigation on the front-page of the dashboard, from which you can access the functionalities of new plugins.
Making a Neatline Map Exhibit
Once Omeka and Geoserver are installed, and the Neatline plugin is uploaded to your server and installed, follow these steps to create your first Neatline map exhibit.
1. Convert a Map Image to Geo-Referenced .tiff
A .tiff file is kind of image file, to which information can been added to indicate to a machine reading the file which portion of the globe the file is intended to portray. There are a number of ways in which this can be done. If you have access to Arc GIS software, it is probably your best choice – a good tutorial on how to geo-reference historical maps using Arc GIS for use on Neatline has been made available by the University of Virginia’s Scholar’s Lab: http://scholarslab.org/geospatial-and-temporal/using-neatline-with-historical-maps-georeferencing/.
Unfortunately Arc GIS, while it remains the industry standard, is relatively expensive, and if you only want to geo-reference one or a hand-full of maps to use on Neatline, it is probably not worth it.
Quantum GIS is a free and open-source platform which is roughly equivalent (and has been making steady gains on Arc GIS in recent years). It can be accessed at http://www.qgis.org/en/site/.
There have also been efforts to make tools specifically designed to geo-reference files – both of the above programs have much wider applications. We have only ever attempted geo-rectification with full GIS suites, so I am not able to endorse any of these tools particularly, but they are worth considering if you find full GIS suites daunting.
Editor's Note: If you only need to rectify an image, the online and open source MapWarper tool is a great, free and simple solution. The tool can be found at http://mapwarper.net
If you are constructing the entry on Neatline, leave this space blank. It is important only if you are importing Omeka items as Neatline records. If you do decide to import Omeka items, and later want to change the record through Neatline, you will have to delete the Omeka ID in this field, to break the link between the Neatline Record and the Omeka item, to make them separately editable.: Again, generally leave blank. The slug is the last portion of a URL, but if you only want the Omeka exhibit to be viewable as a whole, slugs for individual annotations are not necessary.: Here give the desired title for your annotation.
Note that if your map does not correspond well to real geography, you are under no obligation to geo-rectify your map correctly – it is entirely possible to simply place your map image over some convenient portion of the globe.
2. Upload .tiff file to GeoServer.
Again, the exact process will vary based on the way in which you are hosting GeoServer. The file path of location in which the files should be stored will probably end with “…/geoserver/data/MyGeoTiffs.”
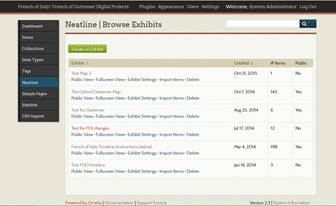
3. Create Neatline Exhibit.
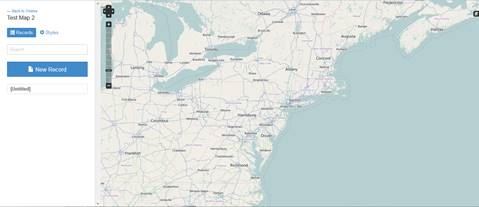
From the Omeka dashboard, select “Neatline,” from the left-hand navigation, and choose “new exhibit.”
4. Import .tiff file from Geo-Server to Neatline Exhibit.
Open your new Neatline exhibit, and click “New Record.”
Most Neatline records will be files which are stored within Omeka itself; however Neatline can also treat some externally stored files as records.
Under “style,” scroll down, and you will see two entries: WMS Address, and WMS Layers. WMS stands for Web Map Service.
For a general guide to this protocol, see https://developers.arcgis.com/ios/objective-c/guide/wms-layer.htm. The WMS Address is a URL giving the location of the server folder in which your .tiff file is stored – the form will vary based on how your server is set up, but it will generally relate logically to your server’s file structure, and you can consult with your server provider (or with institutional IT) if it is not clear.
For our project, the WMS Address is http://frenchofoutremer.com/geoserver/sf/wms. Under “WMS Layer,” enter the name of the level above “wms,” in your url and server file structure (in our case “sf,”) followed by a colon and the name of layer you wish to import. Multiple .tif files can be uploaded simultaneously if the names are separated with commas (i.e. “pf:name1,name2”).
Relatively few of the other sections which can be filled are likely to be relevant to an underlying map layer. These other sections are described in more detail in: What do all the Fields on Neatline Records Mean?– you can always come back and add additional information to the record representing your underlying map later. For now, click the blue “Save,” button, and your historical map will be added to the Neatline exhibit (though you may have to click and drag the underlying map to get to the point to which you geo-rectified it).
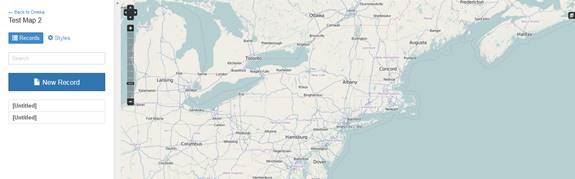
5. Create Records with Desired Annotations.
It is possible to create annotations on Neatline itself by using the “New Record,” button, and filling out the offered fields. It is also possible to import Omeka “Items,” as Neatline “Records,” but if you are only interested in annotating the map, this is only a more complicated way of achieving the same thing. Click “New Record,” and fill out information for your new annotation.
The next section provides guidance on the available fields within any given record, and how they should be filled out when you are making a map annotation.
What do all the Fields on Neatline Records Mean?
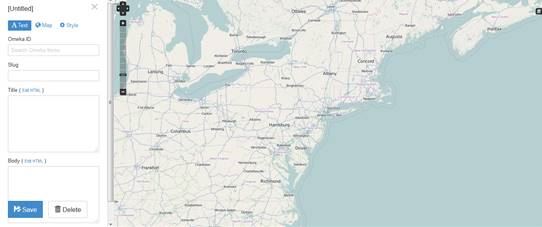
1. The Text Tab:
- Omeka ID: If you are constructing the entry on Neatline, leave this space blank. It is important only if you are importing Omeka items as Neatline records. If you do decide to import Omeka items, and later want to change the record through Neatline, you will have to delete the Omeka ID in this field, to break the link between the Neatline Record and the Omeka item, to make them separately editable.
- Slug: Again, generally leave blank. The slug is the last portion of a URL, but if you only want the Omeka exhibit to be viewable as a whole, slugs for individual annotations are not necessary.
- Title: Here give the desired title for your annotation.
- Text: Here, type out your desired annotation.
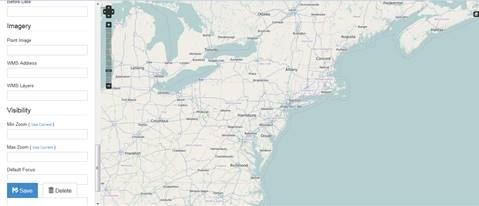
2. The Map Tab
Here, you have the ability to place your annotation somewhere on the map. In order to do this on our project, we used the polygon tool to draw a polygon on the map – the user will be abler to bring up the annotation by clicking anywhere on the polygon.
3. The Style Tab
A large number of tools are available, allowing you to vary the appearance of the annotations, and shapes drawn on the maps. It is not practical to discuss every item listed on this tab, but particularly important is the option at the bottom to “use current viewpoint as default.” This is useful because it allows you to set a position which the map will adjust when a particular item is selected, which can be useful to ensure that the portion on the map is visible at the same time as the annotation.
Continue to Conclusion >>